7 Data Analysis Tools in Excel
Data analysis tools in Excel
Data analysis is a vital part of any business, but it can be intimidating for those who are new to the subject.
Fortunately, Excel offers a number of powerful tools including PivotTables, Regression, and Macros, among others.
In this article, we’ll discuss 7 of the most powerful data analysis tools in Excel for beginners, as well as some tips on how to get the most out of them.
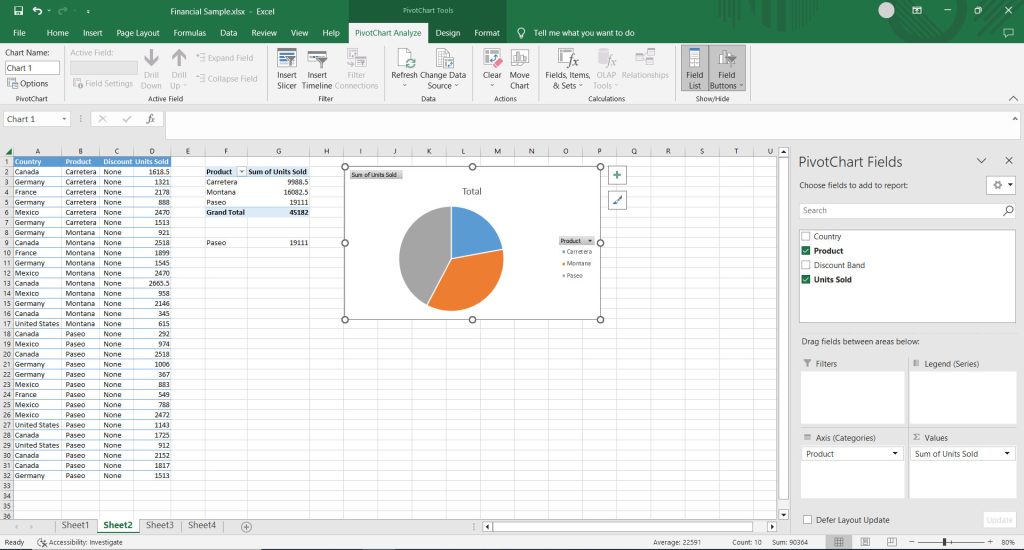
1. PivotTables
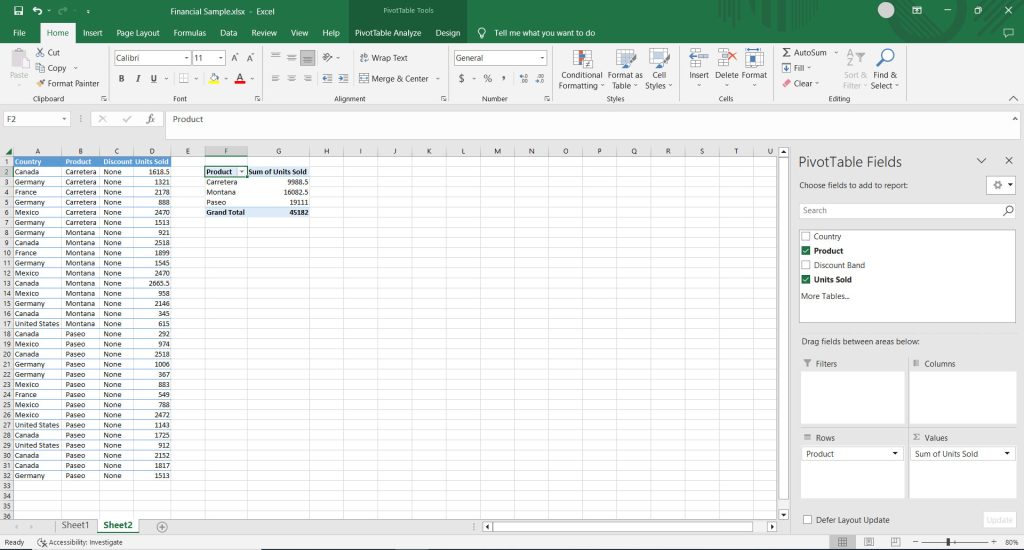
PivotTables are exceptional for summarizing lots of rows of data. They allow you to transform raw data by summarizing data into meaningful information that you can filter, sort, and create subtotals.
PivotTables also allow you to easily reorganize and rearrange data so that you can get a better understanding of it. They are easy to use and can be a great introduction to data analysis for beginners.
2. VLookup
The VLookup function searches for a value in a separate table of data. It allows you to find a value based on a particular piece of information. This can be helpful when you have a table of data that includes information that isn’t always relevant to your analysis.
For example, you might have a table that includes details about your customers, including their names and addresses. While this information is important, it isn’t always relevant to your analysis. The VLookup function can help you retrieve relevant information quickly and easily.

3. Regression
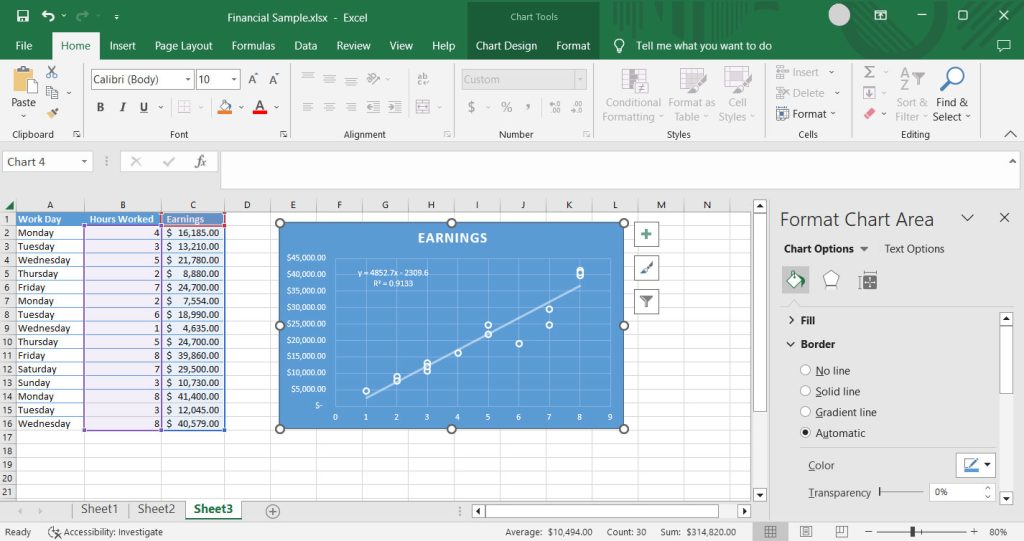
The regression function finds a relationship between two pieces of data. It can help you to find out if one piece of data is related to another.
For example, you might want to find out if there is a connection between the number of hours worked per week and the amount of money made per week.
This can be helpful when you’re trying to find out if a certain factor affects your data. It can also be helpful when you’re trying to make predictions based on data.
4. Math Functions
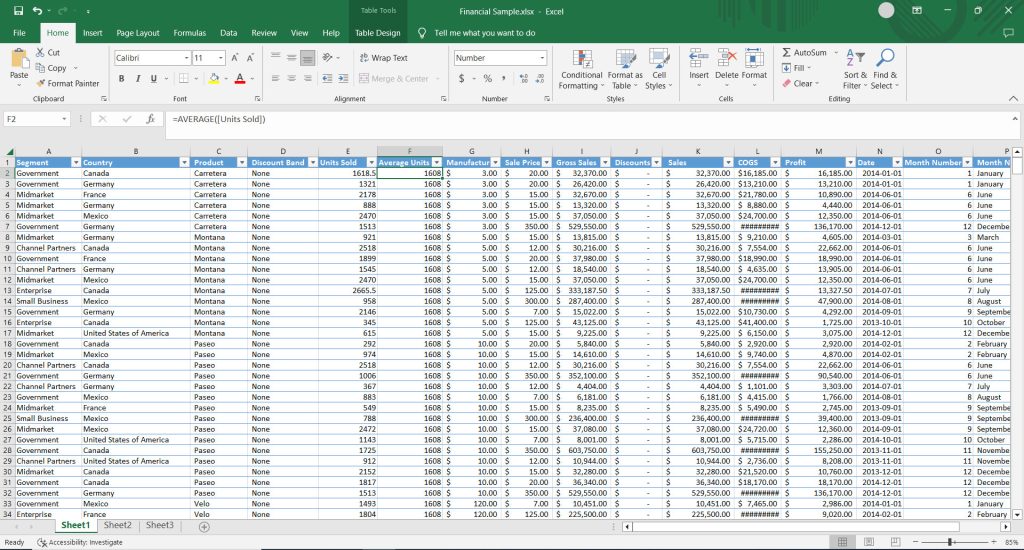
When you’re doing data analysis, you’ll often need to perform calculations. You can do this manually or use the built-in math functions in Excel. The math functions can help you quickly perform calculations without doing anything manually.
Some of the most common math functions are AVERAGE, SUM, COUNT, and ROUND. Using the math functions in data analysis is an essential data analysis tool in Excel and can help you find outliers or any issues with your data.
5. Charts, Graphs, and Maps
Another helpful way to analyze your data is to create charts, graphs, and maps. This can be a great way to visualize your data and make it easier to summarize numerical data.
Creating charts, graphs, and maps is easy with Excel. You simply need to select the data you want to include, select the type of chart you want, and let Excel do the rest.
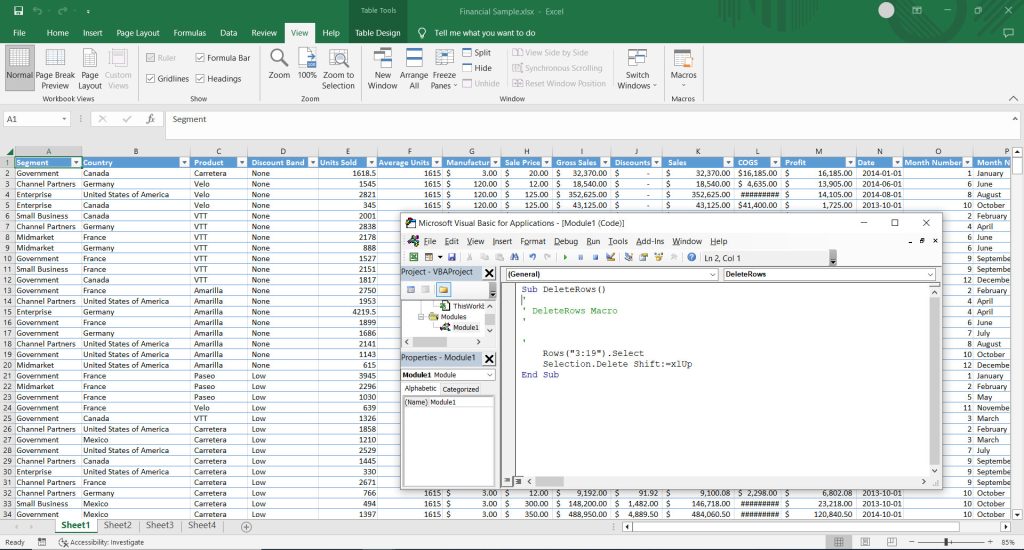
6. Macros
Macros are snippets of code that tell Excel to perform a specific task or series of tasks when a particular button is pressed. Data analysts use Macros to automate tedious or repetitive tasks.
For example, macros can be used to analyze your data and perform quality control checks. They can also be used to copy and paste data from one place to another.
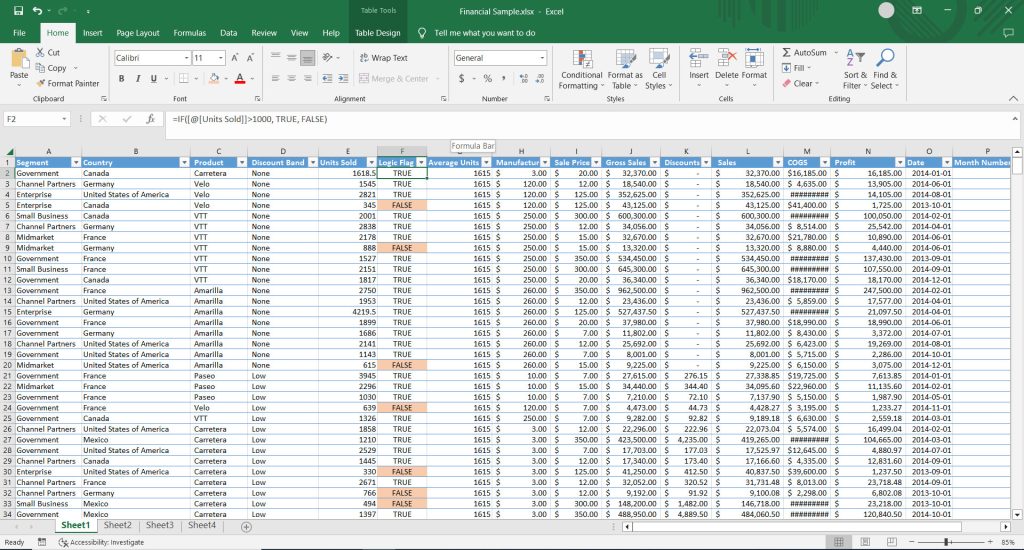
7. Logic Functions
Logic functions are used to make decisions based on your data. We can use them to select data from a table and return a simple TRUE or FALSE statement. This can be helpful when you want to choose certain data for your analysis and leave out other data.
In data analysis, you might want to use a logic statement to check if a value is over or under a certain value. For example, if a cell exceeds a value of 1000, you can flag it using a logic function.
Conclusion
If you’re looking to perform data analysis, Excel is a key part of any business. It helps determine where you should be focusing your efforts, helps you identify potential problems or trends, and can even help you create new products and services.
Excel allows you to do data analysis in many different ways. Whether you’re new to data analysis or just need a refresher course, you can find the right Excel tool to help you out.
These 7 data analysis tools in Excel can help you quickly and easily analyze data so that you can make data-driven decisions. To get the most out of your data analysis, make sure to practice using these tools.


Table Comparison: Data Analysis Tools in Excel
These tools and functions provide a range of capabilities for data analysis in Excel, from basic calculations to more advanced techniques like regression analysis and automation through macros. The table below outlines various data analysis tools and functions in Excel in short form.
| Excel Data Analysis Tool | Description | Functionality and Highlights |
|---|---|---|
| PivotTables | Summarizes and analyzes large data sets dynamically. | Grouping, filtering, summarizing, creating custom views. |
| VLookup | Searches for a value in a table and returns a related value. | Look up data in a table based on a specified criteria. |
| Regression | Performs linear and non-linear regression analysis. | Predicts future values based on historical data. |
| Math Functions | Includes various mathematical functions for calculations. | SUM, AVERAGE, MAX, MIN, COUNT, etc. |
| Charts, Graphs, and Maps | Creates visual representations of data. | Line charts, bar charts, scatter plots, heat maps, etc. |
| Macros | Automates repetitive tasks by recording and running macros. | Customizable automation of tasks using VBA. |
| Logic Functions | Performs logical tests and returns values based on conditions. | IF, AND, OR, NOT, etc. |
Related Data Analysis
What Is a Data Science Unicorn?
A Primer on Data Science in Government: From Projects to Problems
7 Reasons Why You Should Become a Data Scientist
An Insider’s Guide to Becoming a Data Analyst – From Basics to Pro
The Ultimate Guide to Data Science Internships
A Day in the Life of a Data Scientist: The Daily Routine
The Statistics Skills Every Data Scientist Needs to Master
25 Essential Data Science Tools