10 Essential Data Management Tools
Data Management Tools
Data management is an integral part of businesses, research, and many other sectors. With the right data management tools, organizations can gain valuable insights that can give them a competitive edge. From data storage to data mining, this article will discuss 10 essential data management tools.
1. Python

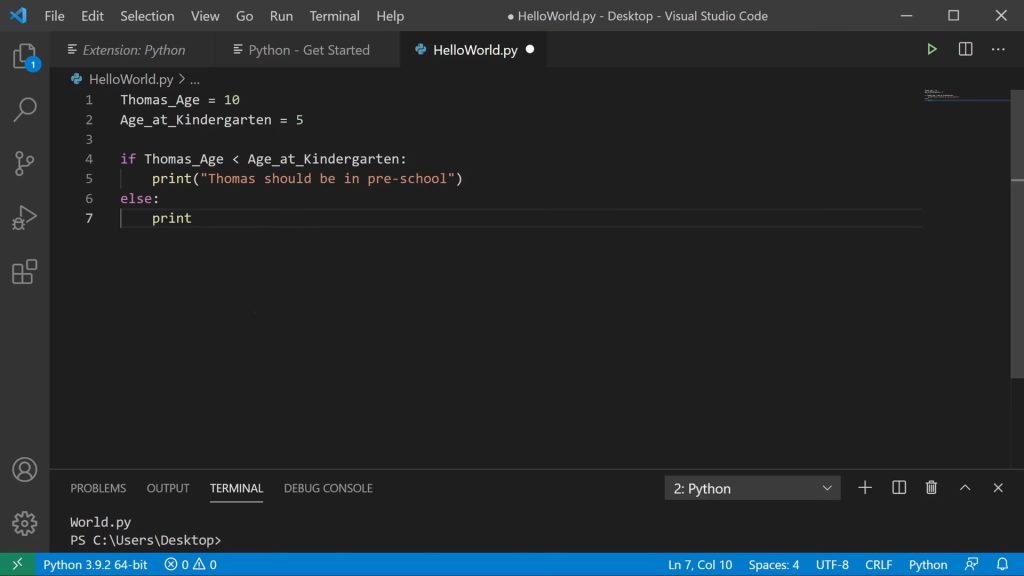
Data managers use Python for a variety of tasks. Python is a powerful language that can be used to gather, clean, analyze, and visualize data. By leveraging Python libraries, it’s possible to query databases, scrape websites, create automated scripts, and perform statistical analysis.
Python can also be used to create predictive models, which allow data analysts to forecast outcomes based on past data. Additionally, Python is often used to create interactive visualizations, as well as to develop dashboards and reports.
Finally, Python can also be used to integrate data from multiple sources, allowing for more efficient analysis. In short, Python provides data analysts with a powerful toolkit for performing complex data management and analysis tasks.
2. Microsoft Excel
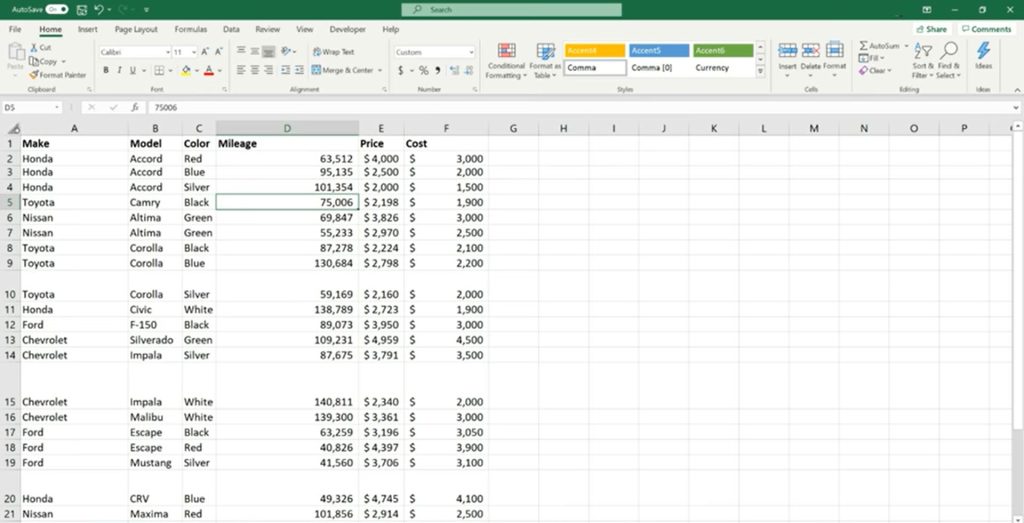
Microsoft Excel can help data managers to visualize, analyze, and manipulate data. In data management, we use Microsoft Excel to explore data, create charts and graphs, build formulas and functions, and format data for further analysis.
With its ability to quickly turn raw data into meaningful information, Excel has become an essential tool for data analysts. Data managers use Microsoft Excel to quickly analyze and visualize large amounts of data.
By leveraging the various charting and graphing tools in Excel, data analysts can quickly summarize and present data in a visually appealing way. Excel also allows for the creation of formulas and functions to calculate summary statistics, such as means and medians, as well as complex calculations, such as linear regression.
3. Tableau
Tableau allows anyone to easily explore, visualize, and communicate data. It provides an interactive environment for data exploration and analysis, allowing analysts to quickly create visualizations, dashboards, and reports.
Tableau also enables analysts to connect to a variety of data sources, including relational databases, spreadsheets, and cloud-based sources. Data managers use Tableau to analyze large amounts of data in order to gain insights and formulate strategic decisions.
With Tableau, they can quickly identify patterns and trends in their data, as well as perform complex calculations and drill down into specific details. Tableau also allows analysts to apply advanced analytics, such as predictive analytics, machine learning algorithms, and data mining, in order to uncover deeper insights into their data.

4. Google Sheets
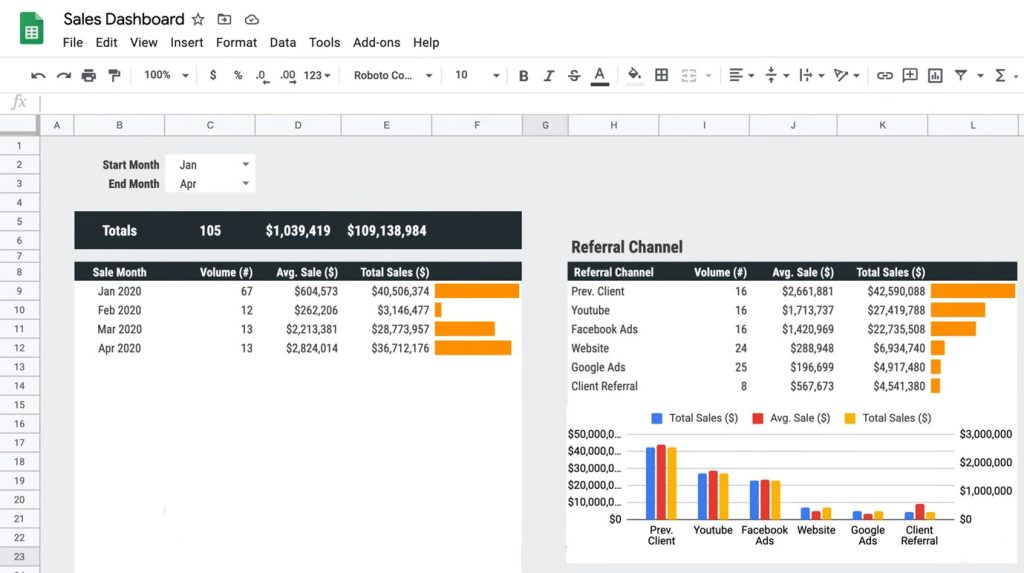
Similar to Excel, Google Sheets offers a wide range of features and functions that make it easy to collect, organize, analyze, and report data. But it’s cloud-based. We can use Google Sheets to pull data from multiple sources, such as databases, spreadsheets, and APIs, to create comprehensive reports.
It also allows them to quickly filter, summarize, and visualize data in a variety of ways and create charts and graphs to present the data in an easy-to-understand format. Additionally, they can use Google Sheets to monitor trends over time, identify correlations and outliers, and develop predictive models.
Furthermore, data analysts can use Google Sheets to collaborate with other colleagues by sharing the spreadsheet and allowing them to add comments, edits, and suggestions. By using Google Sheets, data analysts can easily store and organize large amounts of data, enabling them to make more informed decisions and better understand the data they are analyzing.
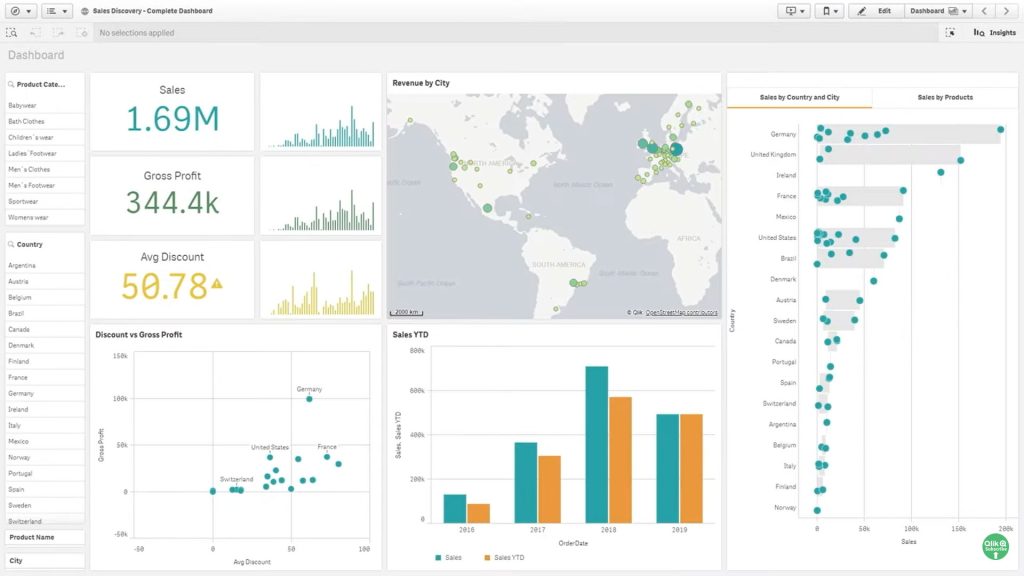
5. Qlik

Data managers use Qlik to gain insights from data by creating interactive visualizations and reports. Data analysts can build apps with the Qlik platform, which allows them to explore data and discover connections that would otherwise be difficult to identify.
The intuitive drag-and-drop interface makes it easy to combine data from multiple sources, create visuals, and share insights with stakeholders. Analysts can also use Qlik to integrate data from various sources into a single platform for analysis. This allows for faster decision-making and a better understanding of the data.
Additionally, Qlik Sense provides an AI-powered analytics engine that enables analysts to quickly find patterns in the data, perform advanced calculations, and reveal trends that may have been previously hidden. With this type of technology, analysts can quickly uncover insights, develop better strategies, and make informed decisions.
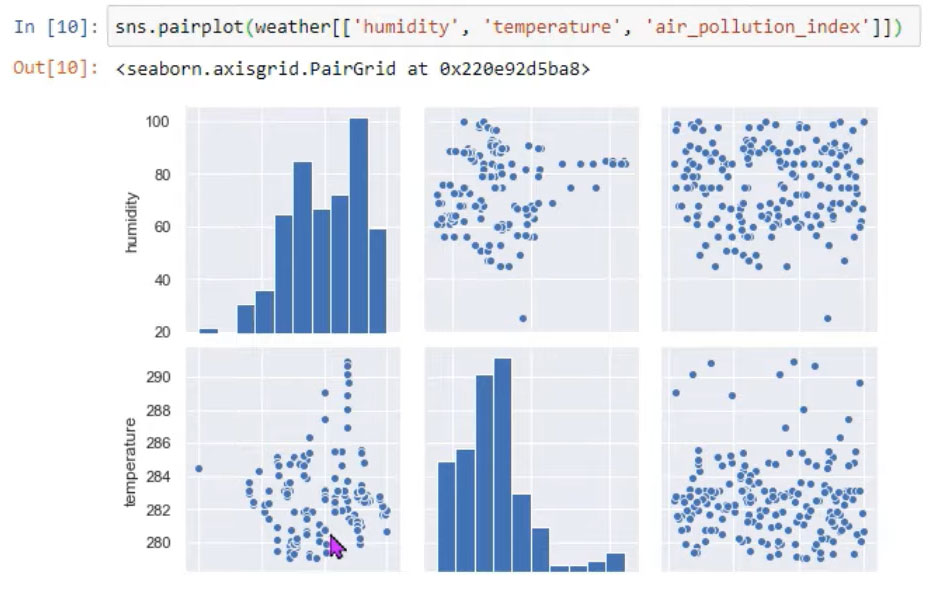
6. Jupyter Notebooks

Data managers use Jupyter Notebooks to analyze, explore and visualize data. They can use the notebook environment to quickly code in Python, R, or other programming languages, run code interactively and display results in a variety of formats.
We can use Jupyter Notebooks to develop data-driven applications, create interactive dashboards, and more. With Jupyter Notebooks, data analysts can create reproducible workflows that document the steps taken to reach conclusions and share results with colleagues.
Finally, data managers can save notebooks as scripts for automation purposes, such as scheduling data processing tasks. By using Jupyter Notebooks, data analysts can easily combine code, visualizations, and narrative text into one document, making their data analysis process efficient and organized.
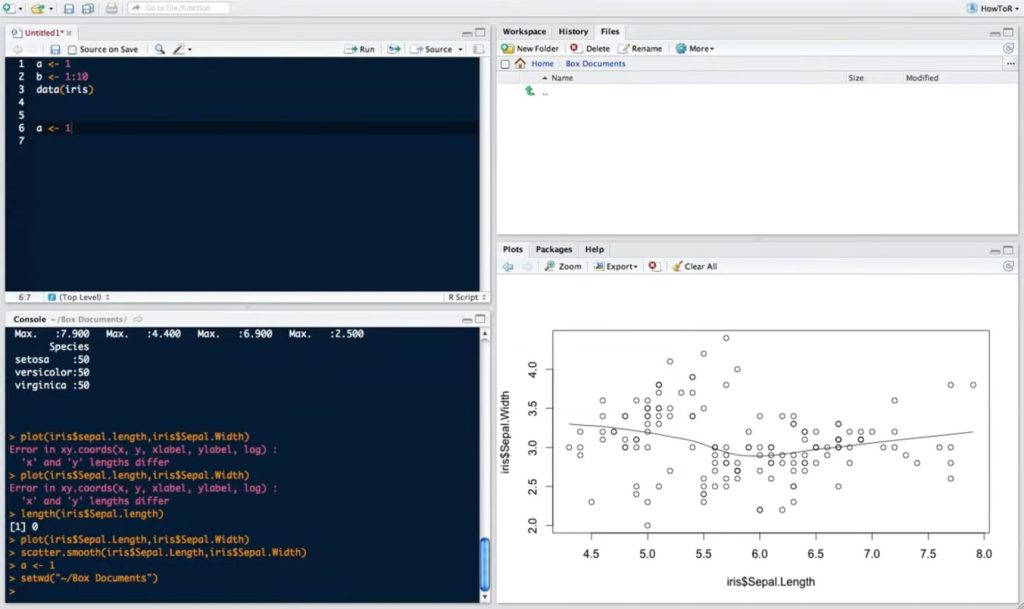
7. R Language

Data managers use the R programming language to clean and visualize data, build models, and develop statistical models. R is a powerful tool for data manipulation, analysis, and visualization.
Data analysts use R language to explore and analyze datasets, identifying trends and patterns in data. They use it to build predictive models and statistical software that can be used to make decisions based on data.
R is also used to create visualizations to better understand data and make sense of large datasets. Additionally, data analysts use R to develop interactive web applications that can be used to present data. Overall, it provides the ability to quickly and easily create complex statistical models.
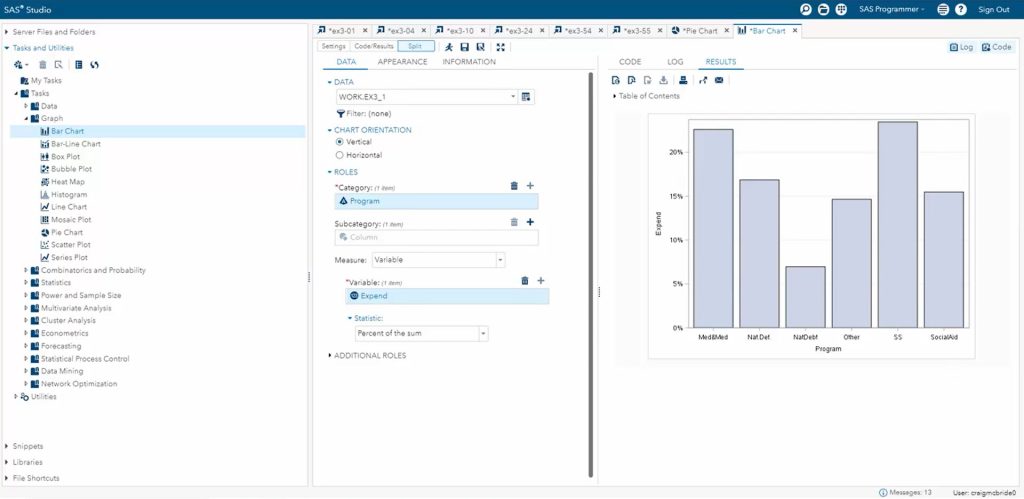
8. SAS

Data analysts use SAS for a variety of tasks, including data management, analysis and modeling, reporting, and visual analytics. SAS enables users to access, manage, analyze, and report on data from multiple sources.
It can also help them prepare and standardize data for analysis and modeling. Data analysts can use SAS to create interactive dashboards and visualizations, enabling them to better understand their data and make informed decisions.
Additionally, SAS supports advanced analytics techniques, such as machine learning, natural language processing, and sentiment analysis. This helps data analysts gain deeper insights into their data and uncover hidden patterns and relationships. They can also use it to create predictive models and identify trends in their data.
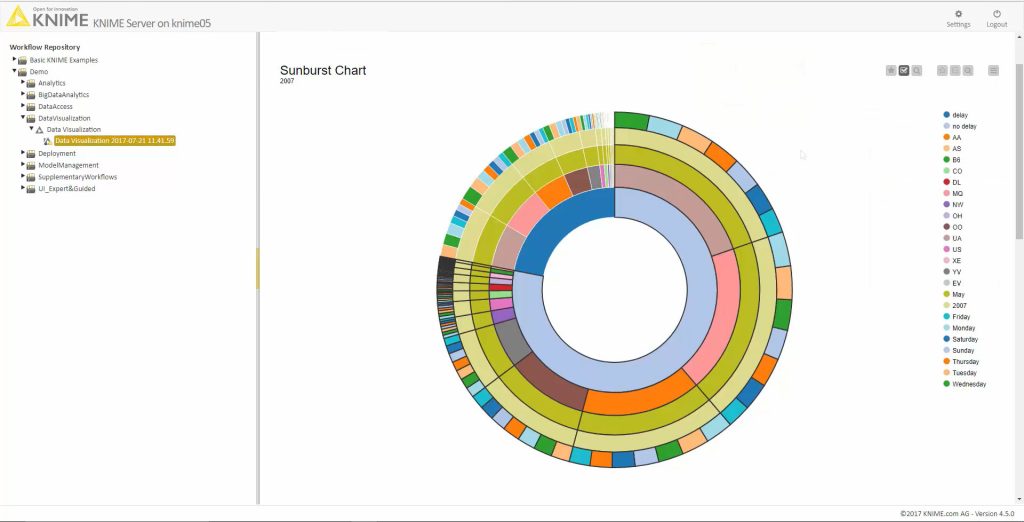
9. KNIME

KNIME (Konstanz Information Miner) is a data analytics platform to clean, transform, and analyze data. It offers an intuitive graphical user interface that allows users to easily create sophisticated data pipelines and workflows using nodes and connectors.
Data analysts use KNIME to aggregate, filter, and manipulate data from multiple sources, including structured and unstructured data. They can also leverage the platform’s machine learning capabilities to create predictive models and uncover valuable insights.
Additionally, KNIME provides features like automated workflows, which enable data analysts to quickly build and deploy repeatable processes and workflows for rapid data analysis. KNIME also makes it easy to share results with colleagues, allowing data teams to collaborate on projects more efficiently.
10. Apache Spark
Apache Spark is an open-source distributed computing platform that is widely used by data analysts. It has become a popular choice for many data analysts due to its ability to process large amounts of data quickly and efficiently.
Data analysts use Apache Spark to analyze, process, and visualize data. By utilizing the distributed computing capabilities of Apache Spark, data analysts are able to process massive amounts of data quickly, often in near real-time. This allows data analysts to gain valuable insights into their data sets which can improve their decision-making processes.
Apache Spark can also be used for machine learning tasks such as classification, clustering, and recommendation systems. Additionally, Apache Spark provides tools for streaming data processing, allowing data analysts to monitor and respond to data in near real time.
Related Data Management
Why Use Microsoft Access Over Excel: What You Need to Know
PostgreSQL vs MySQL: A Comparison of the Two Databases
What Is a Database? The Basics of Databases
Where Can I Get Free Databases to Practice SQL?
A Beginner’s Guide to Starting a Database Administrator Career
An Overview of Different Database Types
How to Become an Entry-Level Database Administrator
10 Essential Data Management Tools