25 Essential Data Science Tools
In this article, we will be exploring 25 of the top data science tools that are currently available on the market. From data analysis to machine learning and visualization, this article will provide an overview of the best data science tools to help you decide which one is best for your needs.
Programming Languages
Learning the right programming languages is essential for any data scientist wanting to stay ahead of the curve. With the right set of programming languages, data scientists can unlock their potential to uncover new insights from data.
1. Python
Data scientists use Python for data analysis, data visualization, machine learning, automation, and much more.
With its robust library of packages, Python is an ideal language for data science because it offers powerful tools that make it easy to work with large datasets.
For example, data scientists use Python to create algorithms and models that can analyze data and help businesses make informed decisions.
2. SQL
Data scientists use SQL (Structured Query Language) to query, manipulate, and analyze data stored in a database. It is an essential skill for any data scientist since it allows them to quickly extract data from a database and process it in the most efficient way possible.
With SQL, data scientists can easily and quickly filter out specific data points. Finally, they can also create reports and visualizations to better understand their data and uncover patterns or trends that might not be immediately obvious.
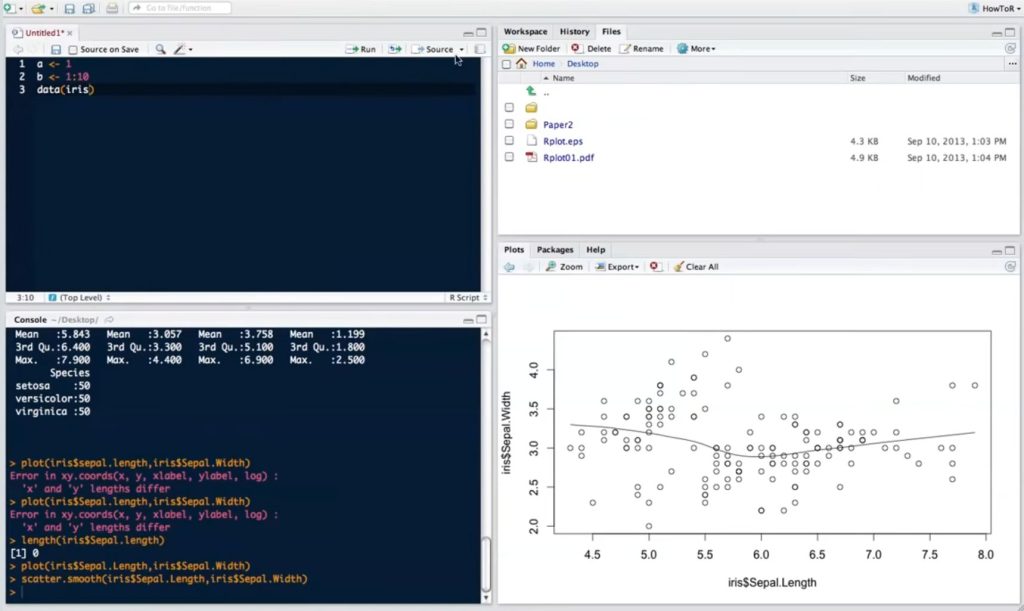
3. R Language
R language is a powerful open source statistical set of tools for processing, analyzing, visualizing, and managing data. With R, data scientists can quickly explore data, develop models, and create meaningful insights.
In addition, R provides numerous packages designed to make common data science tasks easier and faster. These packages include functions for data wrangling, machine learning, statistical analysis, data visualization, and more.
4. Julia
Julia is a high-level, dynamic programming language specifically designed for data science and scientific computing. Data scientists use the Julia programming language to develop powerful, efficient, and highly scalable applications for data analysis.
It combines the speed of compiled languages such as C, with the expressiveness of scripting languages like Python. Its syntax is easy to learn and understand, making it well-suited for both experienced and novice data scientists.
5. NoSQL
Data scientists use NoSQL to store, manage and query large amounts of unstructured data that would otherwise be difficult or impossible to store in a traditional relational database. NoSQL databases (like MongoDB) are generally easier to scale than relational databases.
This makes them ideal for applications with large volumes of data that need to be accessed quickly. As a type of database, NoSQL databases are also useful for applications that require low latency, such as real-time analytics.
Data Analysis Tools
In the data science world, data analysis tools are the building blocks for successful data projects. Knowing which data analysis tools to use, and how to use them, will give you an edge as a data scientist.
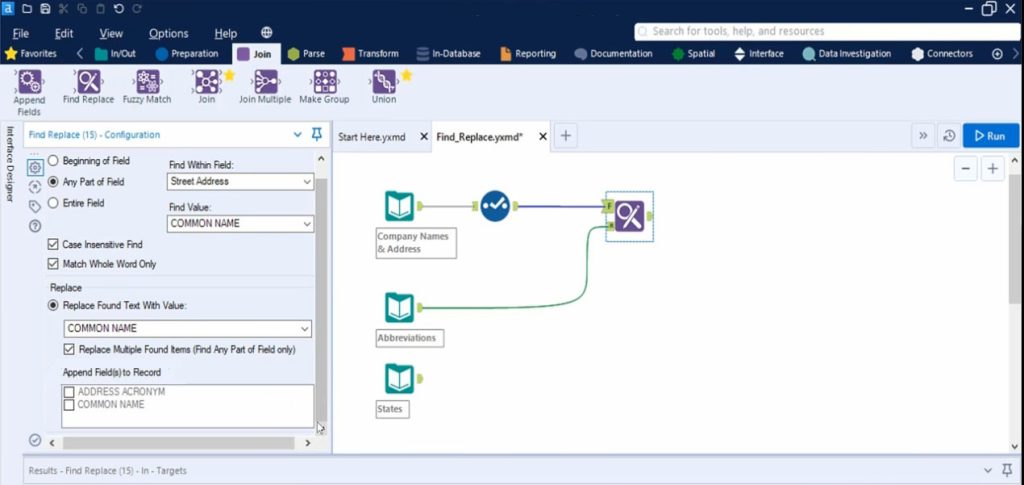
6. Alteryx
Data scientists use Alteryx to automate the data analytics process. By using Alteryx, they can quickly analyze large datasets and uncover insights without writing complex code.
With drag-and-drop tools, they can create visual workflows to ingest, blend, clean, analyze, and output data. They can also join datasets together and apply predictive models to gain deeper insights.
7. Pandas
Pandas is a Python library for loading, pre-processing, exploring, cleaning, and transforming data. Pandas is a powerful open source library for Python that provides high-performance, easy-to-use data structures, and data analysis tools.
Overall, Pandas enables data scientists to quickly and efficiently manipulate and analyze data sets of different sizes and complexity. It goes hand-in-hand with NumPy.
8. NumPy
NumPy is a powerful library for performing numerical calculations in Python. Data scientists use NumPy for tasks related to scientific computing and data analysis.
It enables data scientists to create multidimensional arrays, perform mathematical operations on those arrays, and utilize advanced linear algebra and statistical functions.
Additionally, data scientists use NumPy for tasks such as generating random numbers, creating matrices, and manipulating arrays.
9. Apache Spark
Apache Spark is a powerful tool for data scientists, as it allows them to easily manipulate and analyze large datasets quickly.
Data scientists can use Apache Spark to work with multiple data sources, including structured and unstructured data, and then process and analyze it in real-time.
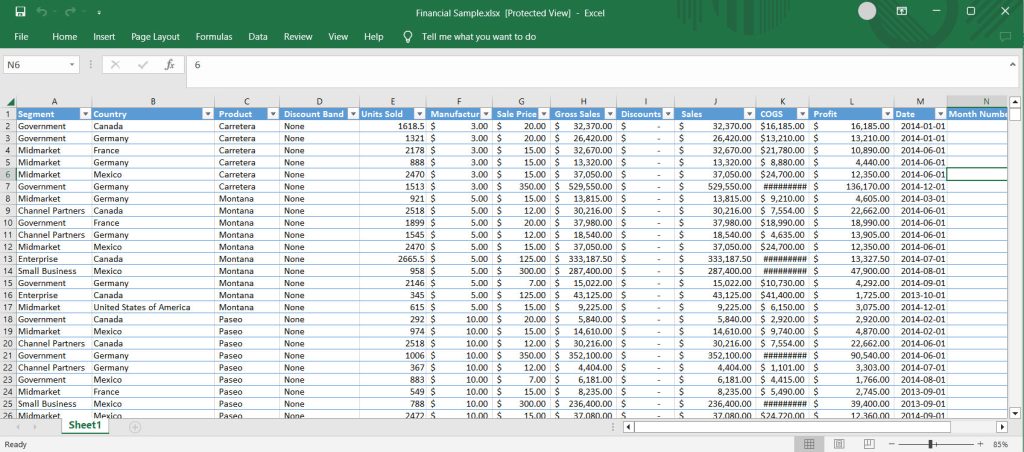
10. Excel
Although many don’t think Microsoft Excel is a true data science tool, it allows anyone to quickly and easily manipulate and visualize large amounts of data.
For example, Excel’s data analysis tools such as pivot tables, formulas, and charts make it possible to quickly explore data, identify patterns and trends, and discover insights.
Data scientists can also use Excel to create predictive models that help them make decisions based on the data they have available. Excel data visualization is also easy to get started.
Data Visualization Tools
Data visualization is a powerful tool for data scientists, allowing them to quickly and easily identify patterns, trends, and correlations in data sets. With the right data visualization tools, data scientists can quickly convert raw data into data-driven solutions.
11. Tableau
Tableau is an incredibly versatile tool, allowing data scientists to use it for basic data exploration, as well as more complex predictive analytics and machine learning tasks.
Data scientists use Tableau to analyze and visualize large data sets and to create powerful, interactive visualizations that can be used to tell a story.
With Tableau, data scientists can easily filter and drill down into data sets, create custom visualizations and dashboards, and quickly share their findings with others.
12. Jupyter Notebooks
Jupyter Notebooks allows data scientists to explore, analyze, and visualize data. It also provides an interactive environment for data scientists to work with code, data, and visualizations in one place.
Data scientists can use the Jupyter Notebooks to prototype ideas, build models, and share results with colleagues. They are particularly powerful for working with large datasets and for performing complex data transformations.
13. Qlikview
Qlikview helps explore and analyze data in order to gain insights and create actionable plans. Data scientists use it to develop powerful visualizations that allow users to quickly identify patterns, trends, and relationships in data sets.
Qlikview has a drag-and-drop interface to quickly create charts, graphs, and other visualizations. Additionally, it enables data scientists to uncover correlations between different variables, identify outliers, and detect anomalies. This makes it one of the top data visualization tools in the market today.
14. Matplotlib
Matplotlib is a Python plotting library that can be used to create a wide variety of plots, including line graphs, histograms, bar charts, scatter plots, and more. Data scientists use Matplotlib to effectively communicate the insights they uncover in data through the visual representation of data.
Furthermore, Matplotlib has an extensive library of built-in functions and tools that allow data scientists to quickly and easily generate visuals with minimal effort. Ultimately, Matplotlib is an invaluable tool used by data scientists to better understand and interpret data.
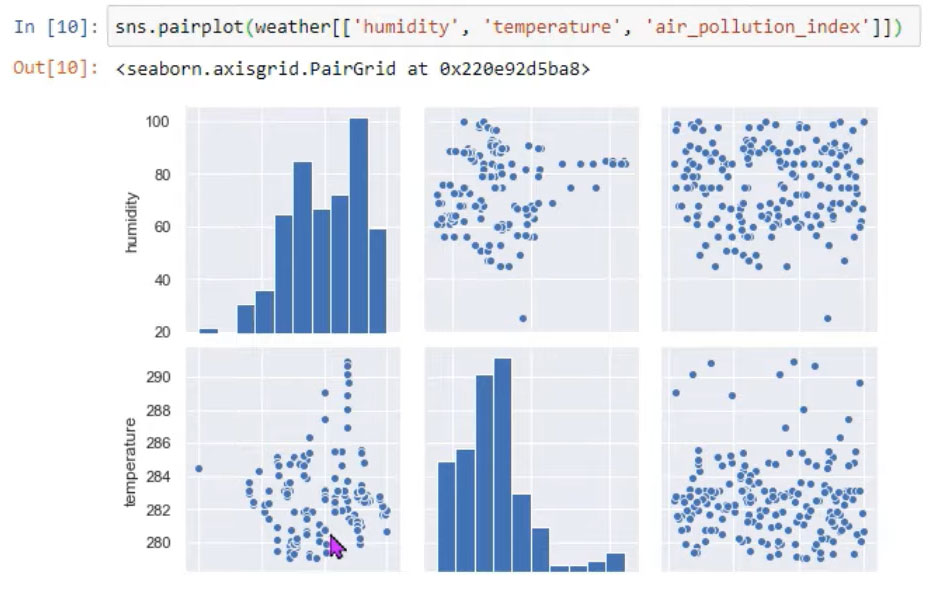
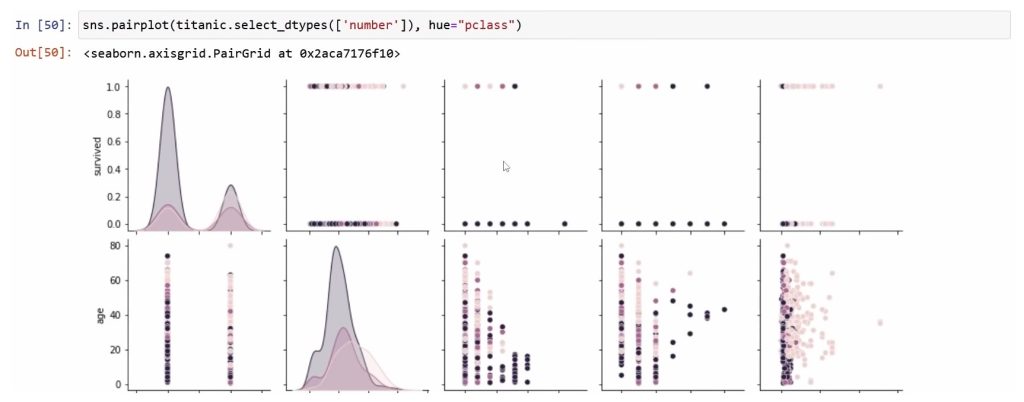
15. Seaborn
Data scientists use the Seaborn library to visualize complex data in a more easily digestible format. Seaborn provides a range of powerful plotting functions that allow data scientists to quickly and easily explore their data visually.
With Seaborn, data scientists can create a wide range of graphs and charts such as histograms, violin plots, bar charts, heatmaps, and more. These visualizations make it easier to identify patterns, trends, and outliers in large datasets.
Additionally, Seaborn provides functions for fitting regression models, analyzing time series data, and creating custom visualizations. Overall, data scientists use Seaborn to gain deeper insights into their data and uncover hidden relationships.
Machine Learning Tools
As the data science industry continues to evolve, ML tools are becoming essential for data scientists everywhere. From understanding the data to problem-solving and implementation, data scientists can create ML models and uncover valuable insights from the data.
16. Tensorflow
Tensorflow is an open-source machine learning library developed by Google, to create and deploy machine learning models.
This library allows data scientists to construct, train, and deploy machine learning models using various frameworks such as deep neural networks, convolutional neural networks, recurrent neural networks, and more.
17. PyTorch
PyTorch is an open source machine learning library based on the Torch library, which was originally developed by Facebook’s AI Research Group.
Data scientists use PyTorch for a variety of tasks, including deep learning and machine learning. It is used for applications such as natural language processing, computer vision, and time-series analysis.
18. Scikit-learn
Scikit-learn offers a wide range of algorithms for data preprocessing, classification, regression, clustering, and dimensionality reduction, as well as other related tasks.
Data scientists use Scikit-learn as a machine learning library to create and evaluate predictive models. It also provides utilities for feature selection, model selection and model evaluation.
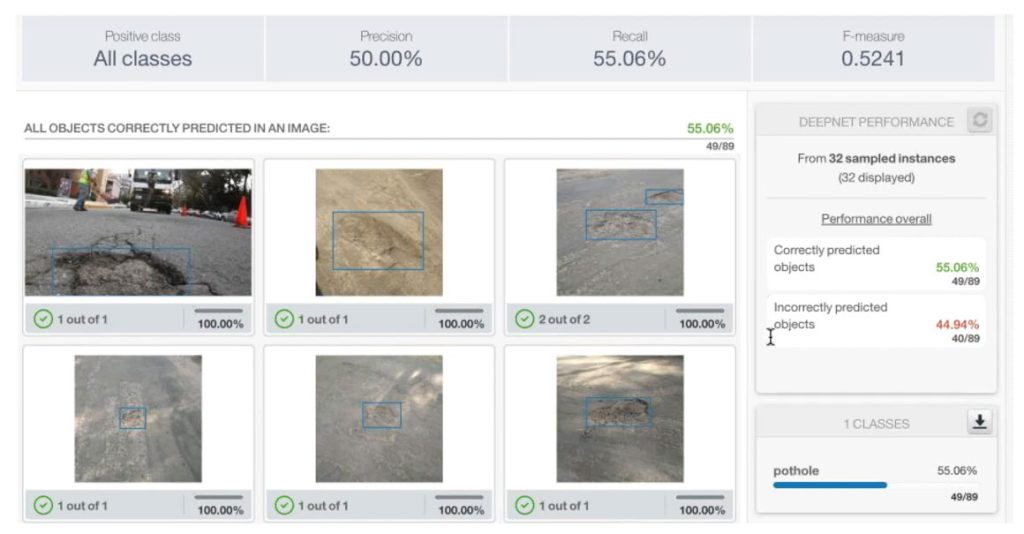
19. BigML
Through BigML, data scientists can easily upload datasets and leverage machine learning algorithms to create powerful predictive models. BigML offers a range of supervised and unsupervised machine learning algorithms.
Additionally, BigML’s cloud-based platform allows data scientists to collaborate with other team members, making it easier to share insights and results with the team.
20. Keras
Keras is a high-level neural networks API written in Python designed to make working with complex deep learning models easier. Data scientists use Keras to create and train deep learning models in image classification, natural language processing, text classification, and time series analysis.
Keras provides a range of tools to build, train, and evaluate deep learning models, such as optimizers and cost functions. It also allows for easy model deployment to production environments.
Business Intelligence Tools
From powerful data visualization tools to intuitive analytics dashboards, there is a wide variety of business intelligence tools that data scientists need to know.
21. SAS
Data scientists use SAS to analyze, visualize, and extract insights from large and complex datasets. SAS is especially useful for predictive analytics, which involves using statistical analysis techniques to predict future outcomes or trends.
With SAS, data scientists can quickly and effectively explore and analyze data, develop predictive models, and create reports and visualizations that provide a clear picture of the data.
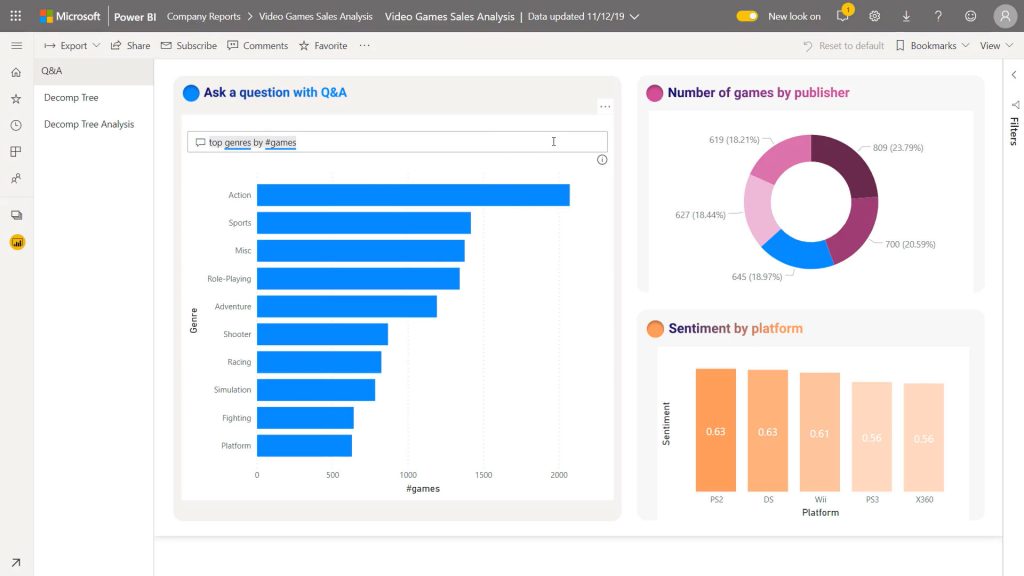
22. Power BI
Microsoft PowerBI is a valuable tool for data scientists to quickly explore large datasets and create interactive dashboards. It allows users to combine data from multiple sources, visualize the data in charts and tables, and create reports to share with others.
With PowerBI, data scientists can quickly identify trends, spot outliers, and compare different variables. They can also identify correlations between different sets of data, which helps them to make better decisions.
23. IBM Cognos
IBM Cognos is a software suite designed for data scientists and business intelligence professionals to analyze and visualize data. With IBM Cognos, data scientists can access and integrate data from multiple sources, build data models, and create reports and dashboards.
In addition, data scientists can use IBM Cognos to explore data, identify trends and patterns, and better understand their business performance. Finally, they can also use the software to develop predictive analytics models and machine learning algorithms and to generate interactive visualizations of their data.
Big Data Tools
From data mining and machine learning to visualization and predictive analytics, there are a variety of big data tools available to help you get the most out of your data.
24. Apache Hadoop
Apache Hadoop is a big data open-source software framework that allows data scientists to quickly and easily process and store large datasets.
Hadoop enables distributed computing and is useful for analyzing large datasets that cannot be stored in one computer or that are too large to analyze using traditional methods.
25. KNIME
The main purpose of KNIME is to enable data scientists to quickly and easily explore, transform, and visualize data. With KNIME, data scientists can create complex workflows for data wrangling and analysis.
These workflows are often composed of nodes that represent different data-processing steps such as data import, cleaning, filtering, transformation, statistical analysis, machine learning, and visualization.
Essential Data Science Tools
Data science is becoming more important in today’s world. With the vast amounts of data available to us, it’s essential to have the right tools in order to make sense of it all.
By using a combination of these 25 data science tools, professionals can dive into data to uncover valuable insights, patterns, and trends. But did we miss anything? Please let us know in the comment section below.
Related Data Analysis
A Primer on Data Science in Government: From Projects to Problems
5 Steps To Developing A Health Informatics Career
7 Data Analysis Tools in Excel
25 Essential Data Science Tools
The Ultimate Guide to Data Science Internships
The Statistics Skills Every Data Scientist Needs to Master
What’s the Difference Between a Data Analyst and a Data Scientist?
How Data Science Can Help Nonprofit Organizations