Data Storytelling: Where Does Data Fit In? A Beginner’s Guide

When it comes to effective storytelling, people respond to scenes and characters that they can connect with—and that means having a clear understanding of what your audience wants to know and see. The key is to consider not only the facts but also how those facts fit into an overall narrative.
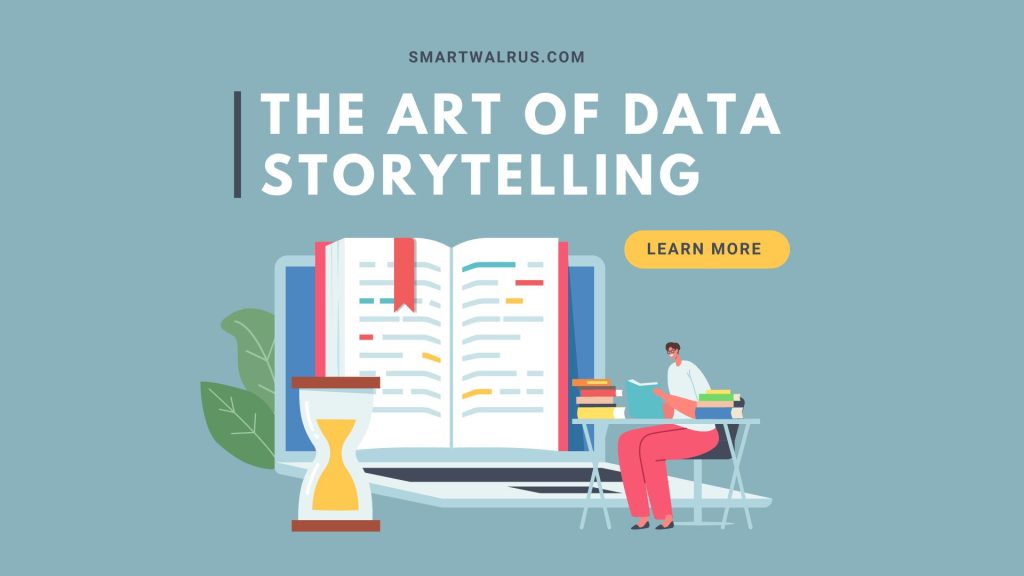
That’s where data storytelling comes in. Data storytelling is the art of weaving data into a cohesive narrative to create an impactful experience for your audience. Data stories can help generate a variety of outcomes, including increasing brand awareness, driving sales, and inspiring action. While visual storytelling platforms are growing in popularity, data storytelling is still underutilized.
What is data storytelling?
Data storytelling is the use of data to tell stories about brands, products, or any type of analysis. Effective data storytelling can help businesses better understand and connect with anyone, and can also help organizations communicate key insights.
Data storytelling can be helpful for marketing but it’s different from traditional marketing. For example, data storytelling seeks to use data to tell stories about a brand’s products and/or services. While traditional marketing often aims to sell products, data storytelling is about helping consumers understand and connect with products—and with the business that produces them.
Use data to tell stories
Data can be a powerful storytelling tool. If you use it to tell stories, it can help you connect with users on a deeper level than ever before. A good way to start is to explore the why of your analysis—and how you can use that to enrich your stories.
Next, consider your target audience. What are you trying to communicate, and what are they looking for? Data can help you answer these questions. Finally, choose the right data to tell your stories with. There are many data sources out there, but only a few will be right for your brand.
Data can be a tremendous asset when telling stories. Just think back to the moment in your life when you connected with an idea, a person, or an event in a new and meaningful way. What was the triggering factor? Was it something a friend said, a book you read, or a song you heard? It could have been something entirely unrelated to you—but it resonated with you in a way that made you feel a certain way. That feeling is what makes for a great story, and data is the source of that story.
Why is effective data storytelling important?
Effectively using data to tell stories is one of the most important parts of any marketing strategy. In order to connect with users, an organization must understand its audiences in order to create content that resonates with them.
But when it comes to the ins and outs of data, brands can often be unsure where to begin. That’s where this article comes in. Through the examples below, you’ll learn how to take advantage of data to enrich your stories and create a stronger narrative.
Here’s a quick video from the Harvard Business Review that explains why the narrative is the most human tool that we have to communicate (skip to 4:19). Because the reality is that storytelling applies an emotional connection with your audience.
Step 1: Define your audience and your goal
Before jumping into any specific data activities, it’s important to first define your target audience and set a goal for your data storytelling. In other words, who are your ideal data consumers, and what do you want to accomplish with your content?
Your target audience will be essential in helping you determine the right data to use in your stories. It’s also important to define your goal so that you know exactly what you’re aiming for. This will help you stay focused on the right metrics and avoid making mistakes.
It’s important to first identify your audience and their goals. This will provide you with an idea of what to include and what problems to solve. Knowing your target audience will also help you determine what data to include in your story.
It’s important to note that your audience doesn’t have to be specific people—it can be a specific type of person, such as a certain age range, a particular gender, or even an entire demographic. Knowing your audience will also help you determine what data to include in your story.
Step 2: Find the right data to story with.
After you’ve defined your audience and goal, it’s time to find the right data to story with. Start by thinking about the questions that your target audience wants to answer. Which questions does your audience want to answer? What are they curious about? What are they worried about? Once you’ve identified these questions, you can begin to look for data that can help you fill in the blanks.
Once you’ve determined what your audience and their goals are, you can find the right data for the story. You want to find data that will help your audience solve their problems. Approach this with an open mind, as you likely won’t find the right data for your story right away. Be persistent and transparent about what you’re looking for, and you should be able to find the right data to help you tell your story.
Step 3: Organize your data into datasets and visualizations
Once you’ve identified your data sources, you need to take that information and turn it into more consumable formats. Before you can organize your data, you need to understand what each source is telling you. To do this, you can use what’s called a data audit.
A data audit is a process where you look through each of your data sources and try to understand what each one is telling you. For each source, do the following:
Finally, you can use these data audit findings to create a clear data strategy for each of your sources. Find the right data visualization tool to tell your story. You might have to combine multiple data points into one data story.
Step 4: Combine data and visuals in a narrative format.
Once your data has been organized and cleaned up, it’s time to start combining data and visuals in a narrative format. Begin by bringing together the data that you identified in your data audit. Next, you can start building out your visual elements. Start with the visuals:
Next, think about how you want to combine your visuals.
Now that you have your data organized, you can start building your narrative. Your story can start with a hook that entices your audience and you can even build tension in a way to transition from one idea to the next.
Bottom line
As you can see, data can be a powerful storytelling tool. By using it to tell stories, you can better connect with your target audience
Data tells a story in and of itself. It’s just a matter of making sure it’s connected to a story and narrative that makes sense.
With the right data and storytelling, you can create content that’s effective, interesting, and enjoyable to consume.


Related Data Visualization
How to Create a Bar Chart in Excel
Scatterplots vs Bubble Graphs: What’s the Difference?
10 Best Data Visualization Tools and Software For Your Business
A Comprehensive Guide to Paving a Career in Data Visualization
Excel Data Visualization: 20 Charts, Graphs, and Plots To Master
Tips For Pursuing a Career in Data Visualization
What is Data Visualization and Why Do We Need It?